Know who is coming. Know why. Know what to do about it.
Geo-spatial mobility intelligence that turns footfall, catchment and workforce data into leasing, marketing and asset decisions across retail, commercial and industrial portfolios. Delivered in partnership with IRL Consulting.
The problem we solve
Most landlords don't really know who is actually around their assets. Retail landlords rely on POS data from anchor tenants and catchment estimates from studies done years ago. Office owners guess at workforce demographics from broker brochures. Industrial owners have no visibility into the workforce supply for the tenants they are trying to attract.
None of that answers the questions that drive real leasing, marketing, site selection and asset decisions: Who is actually around this asset? Where do they live, work and travel? What is their demographic and spending profile? What are competing assets pulling away, and where can we win?
The data foundation
- Mobile location histories from over 120,000 apps globally, capturing real-world movement at scale
- Every observation enriched with Point-of-Interest data, time, date, gender, LSM, income and brands visited
- Updated as frequently as every day plus 48 hours, so you act on what is happening now
- Fully POPIA and GDPR compliant
- National POI database with more than 40,000 verified retail and asset Points-of-Interest
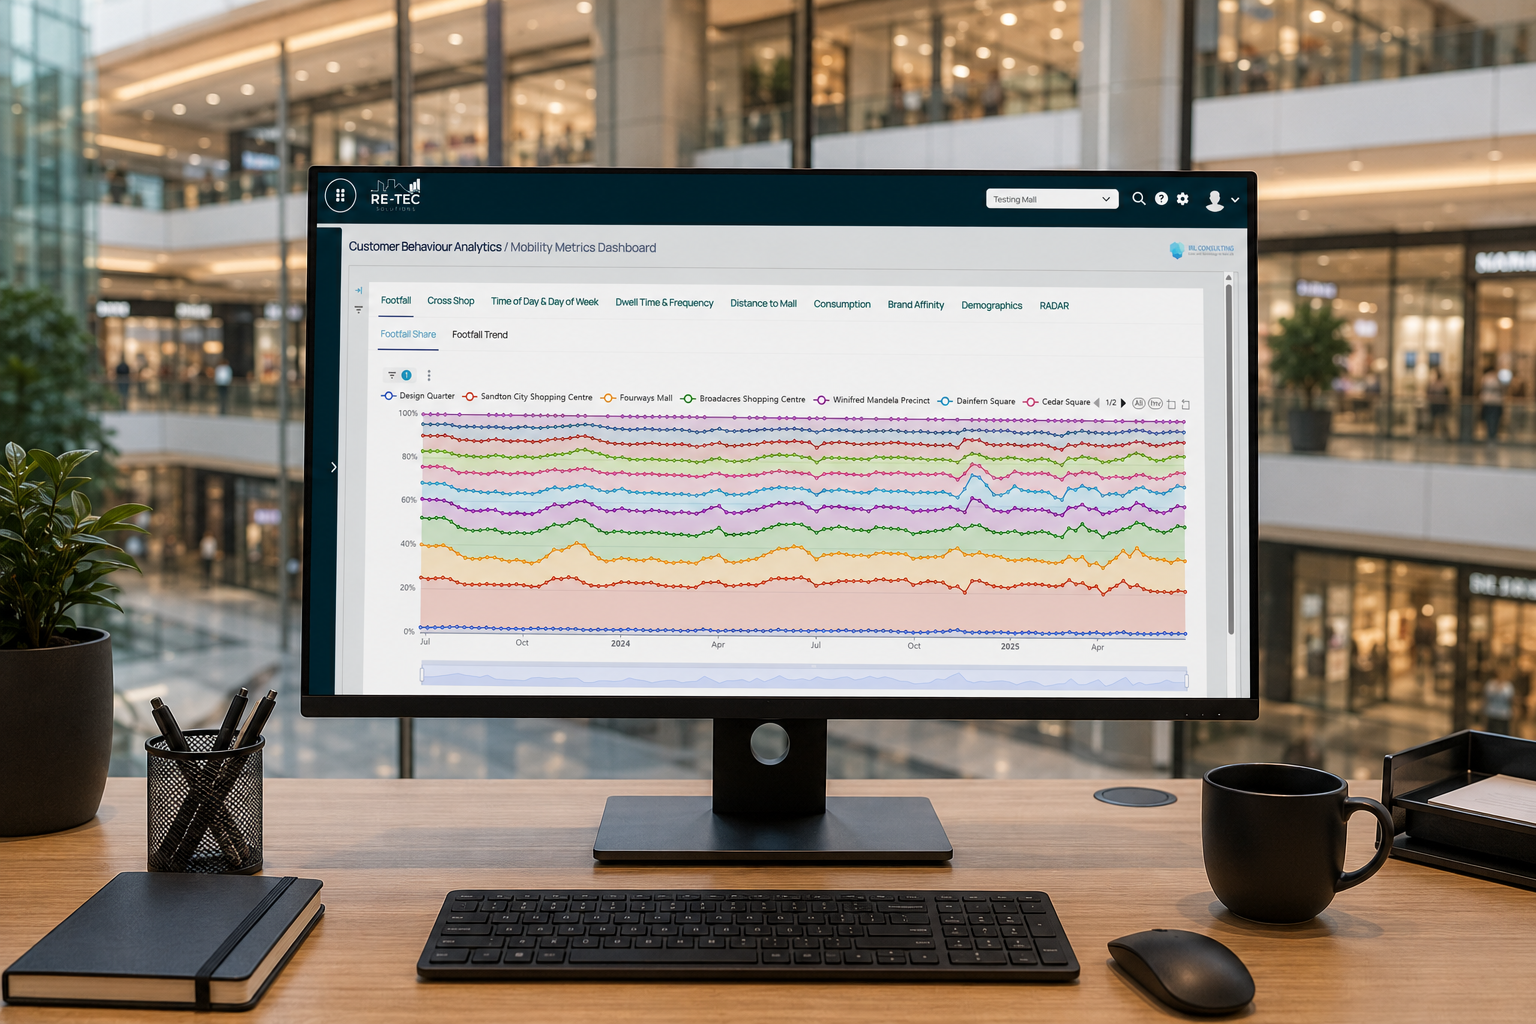

Mobility and footfall
RADAR
Retail Accessibility and Data Analysis Ranking. Benchmarks your asset against category competitors.
Footfall Trend
Trended daily, weekly and monthly footfall by asset, store or group brand.
Footfall Share
Your share of total market footfall as a percentage.
Dwell Time
Average time per observed visit, in minutes.
Frequency of Visit
Monthly average visits per unique customer.
Cross-Shop
Where else your customers shop. Identifies your real competitors.
Catchment and distance
Home Draw
Exactly where your visitors live. Observed catchment, not estimated.
Work Draw
Where your visitors and workforce commute from for work.
Average Distance
Average distance between visitor home and asset.
Suburb Optimiser
Performance by suburb: visitor share, penetration, benchmarking against dominant asset.
CBA across asset classes
Retail
Where CBA started. Tenant mix decisions backed by real catchment data. Marketing investment directed at where the spend actually is.
- Tenant-mix planning grounded in real demographics
- Marketing levy spend allocated to audiences who actually convert
- Renewal conversations strengthened by mobility and turnover signals
- Site evaluation backed by Suburb Optimiser and Brand Affinity
Commercial / Office
CBA tells you where your tenants' workforce actually lives, how they move during the day, and whether the building's catchment fits.
- Work Draw shows where corporate employees commute from
- Demographic fit confirms workforce profile for target tenants
- Daytime visitation patterns by hour, day and segment
- B2B targeting via AD IDs for corporate occupier campaigns
Industrial / Logistics
Industrial is not about consumer footfall. It is about workforce supply, last-mile demand and site economics.
- Workforce supply analysis for warehouse and logistics tenants
- Site selection combining Business Data, Demographics and Visitation
- Last-mile fulfilment catchment modelling for e-commerce
- Population density and demand modelling around logistics nodes
CBA Powers Data-Driven Leasing Intelligence
CBA is not a standalone analytics product. It is the external intelligence layer that feeds RE-TEC's full leasing engine, combining mobility, demographic and workforce data with in-platform deal values, vacancy signal, tenant sentiment and turnover to drive the three decisions that matter most across every asset class.
Tenant selection
Who should be in this space, based on the people actually around it.
Evidence-based pricing
What the right price is, validated by mobility, workforce and spend.
Retention intelligence
Which tenants to retain and grow with, signalled by mobility trends and engagement data.
Built for the people who shape asset strategy
- Retail asset managers making tenant-mix and capex decisions
- Office leasing teams matching buildings to corporate occupier requirements
- Industrial developers running site selection and tenant attraction
- Marketing managers allocating campaign and media budgets
- Strategists and portfolio CEOs evaluating acquisitions and developments